If you stepped outside in Manhattan on an autumn morning in the mid-1960s, you did not just smell the city; you wore it. Soot and smoke from apartment-house incinerators, heating systems, power plants, factories, buses, trucks, and automobiles settled over New York, and under the wrong weather conditions, that pollution could become deadly.
New York City suffered major smog episodes in 1953, 1963, and 1966. The most famous arrived over Thanksgiving weekend in 1966, when a temperature inversion trapped polluted air over the metropolitan area from November 23 through November 26. A later medical study attributed 168 excess deaths to the episode. The disaster became one of the defining moments in New York’s long fight against air pollution and helped intensify the national demand for stronger clean-air laws.
What Caused New York City’s Deadly Smog?
New York City’s mid-20th-century smog disasters were caused by two forces working together. The first was an enormous volume of pollution from fuel combustion, garbage incineration, industry, and vehicle exhaust. The second was a temperature inversion, a weather pattern that prevented those pollutants from dispersing.
Normally, warmer air near the ground can rise and carry pollution upward. During an inversion, a layer of warmer air sits above cooler air close to the surface. That warmer layer acts like a lid, trapping smoke, sulfur dioxide, carbon monoxide, soot, and other contaminants near street level. When winds are weak, the polluted air can remain in place for days.
The Pre-EPA Era: Smog, Incinerators, Coal, and Heavy Oil
New York’s air-pollution problem was already well known before 1966. The smoky haze that hung over the city was sometimes called “smaze,” a combination of smoke and haze. It was an everyday reminder that the city’s economic and population growth had come with a serious environmental cost.
Garbage burning was one of the largest sources. By the 1960s, New York had roughly 12,000 apartment-house and commercial incinerators, in addition to municipal incinerators. These systems sent smoke and particulate matter directly into neighborhood air. Coal and high-sulfur residual fuel oil were also widely burned for heat and power, while automobiles, buses, and trucks operated without the emissions controls that later generations would take for granted.
The city had begun regulating air pollution before the Thanksgiving disaster, but the system was primitive by modern standards. New York operated its own local pollution index, and in 1966 the city’s principal continuous monitoring station was located at the Harlem Courthouse on East 121st Street. One monitoring point was expected to help describe conditions across an enormous city with wildly different traffic, industrial, and residential environments.
New York’s Deadly Smog Episodes of 1953 and 1963
The Thanksgiving smog was not the city’s first warning. In November 1953, stagnant air trapped pollution over New York for several days. Dr. Leonard Greenburg, one of the most important researchers studying the city’s air pollution, later estimated roughly 220 excess deaths associated with that episode.
Another major episode struck in January and February 1963. Studies produced different estimates depending on how excess mortality was calculated, but the event was blamed for hundreds of additional deaths. By the middle of the decade, there was no longer any serious question that New York’s dirty air could become a public-health emergency when weather conditions prevented pollution from escaping.
The 1966 Thanksgiving Smog Disaster
On Wednesday, November 23, 1966, a stagnant air mass settled over the East Coast. Winds weakened, temperatures rose unusually high for late November, and pollution began building over New York City. Carbon monoxide, sulfur dioxide, smoke, and haze accumulated beneath the inversion.
Thanksgiving Day, November 24, brought one of the strangest Macy’s Thanksgiving Day Parades in the event’s history. About one million spectators gathered while the skyline disappeared into the haze. A photograph taken that morning from the Empire State Building showed Lower Manhattan buried beneath the polluted air, with only the tops of taller buildings rising above it.
City officials came close to declaring an emergency on Thanksgiving Day but did not issue the formal alert until Friday, November 25. That first-stage alert was the first of its kind in New York City. Residents were asked to reduce driving and fuel use, people with heart and respiratory conditions were urged to remain indoors, and the city shut down garbage incinerators as officials tried to prevent conditions from becoming worse.
The Wind Finally Returned
Relief arrived on Saturday, November 26, when a cold front and stronger winds finally broke the inversion and dispersed the polluted air. At first, city officials said they could not detect a clear increase in deaths or serious illness. The true impact became apparent only after researchers studied mortality patterns over the following months.
In October 1967, Greenburg reported that the Thanksgiving episode had caused an estimated 168 excess deaths. His analysis found roughly 24 additional deaths per day over a seven-day period, allowing for the delayed health effects that continued after the visible smog had lifted. Earlier New York smog episodes had already shown the same pattern: the air could clear before the full human cost was known.
New York City’s Air Pollution Laws Were Already Changing
The 1966 disaster is sometimes described as the event that suddenly created New York’s air-pollution laws, but the history is more complicated. Earlier that same year, the City Council had already passed Local Law 14, a major air-pollution measure aimed at coal burning and garbage incineration. The Thanksgiving emergency made the need for stronger enforcement impossible to ignore.
The city subsequently expanded its monitoring network and strengthened pollution controls. Amendments adopted in 1968 tightened rules affecting refuse-burning equipment, while later laws further restricted sulfur in fuel and accelerated the disappearance of apartment-house incinerators. By the early 1970s, the city that had once routinely burned garbage in residential buildings was moving decisively away from one of its dirtiest habits.
How the 1966 Smog Influenced Federal Clean-Air Policy
The Thanksgiving disaster did not single-handedly create the modern environmental movement, but it became an important national example of what uncontrolled urban air pollution could do. In January 1967, President Lyndon B. Johnson cited the New York episode in a message to Congress calling for stronger federal action on air pollution.
Congress passed the Air Quality Act of 1967, expanding the federal role in air-pollution research, interstate planning, and enforcement. Three years later, the federal government went much further. The Clean Air Act of 1970 created the basic national framework for controlling major air pollutants, and the Environmental Protection Agency was formally established in December 1970.
New York’s Thanksgiving smog therefore belongs to a larger national story that also included the deadly Donora smog of 1948, London’s Great Smog of 1952, growing concern over automobile pollution, industrial contamination, oil spills, pesticides, and polluted waterways. By 1970, Americans were demanding environmental protections on a scale that would have been politically difficult to imagine only a decade earlier.
How the Modern Air Quality Index Developed
The number New Yorkers now check on their phones before going outside did not exist in its current form in 1966. New York used its own local pollution index during the Thanksgiving emergency, and cities around the country relied on different systems that were difficult to compare.
In 1976, the Environmental Protection Agency introduced a nationally uniform Pollutant Standards Index. The system was later revised and renamed the Air Quality Index, or AQI, in 1999. Today’s AQI places air conditions into categories ranging from Good to Hazardous and combines information about major pollutants into a scale the public can understand quickly.
How New York City Cleaned Up Its Air
Cleaner air came from decades of federal, state, and local changes rather than one law or one technology. Coal burning declined. Federal vehicle standards brought catalytic converters, cleaner gasoline, and tighter limits on tailpipe emissions. Power plants and industrial sources faced stronger pollution rules. New York also continued regulating heating fuels and building emissions.
One of the most important modern local programs was NYC Clean Heat, launched in 2011 as the city moved buildings away from highly polluting No. 6 and No. 4 heating oils. No. 6 oil was phased out, while thousands of buildings converted to cleaner fuels. The result could be measured in the city’s air.
The New York City Community Air Survey, which began neighborhood-level monitoring in 2008 and 2009, has documented major improvements. Between 2009 and 2024, citywide annual average fine particulate matter, known as PM2.5, declined by 36 percent, while nitrogen dioxide fell by 41 percent. The city now measures air quality at locations across all five boroughs instead of depending on anything resembling the single-station system of 1966.
The progress is real, but pollution has not disappeared. Traffic, commercial cooking, building emissions, industrial activity, and regional pollution still create neighborhood differences, and the communities with the heaviest traffic and industrial activity can continue to experience higher pollutant levels.
The New Air-Quality Threat: Canadian Wildfire Smoke
New York’s great mid-century smog episodes were driven largely by pollution generated in and around the metropolitan region. The most dramatic air-quality emergencies of the 21st century have come from much farther away.
In June 2023, smoke from enormous Canadian wildfires turned the New York City sky orange and pushed the AQI into the Hazardous category. City officials reported readings well above 400 during the worst of the event, producing the most severe wildfire-smoke episode in the city’s modern air-quality record.
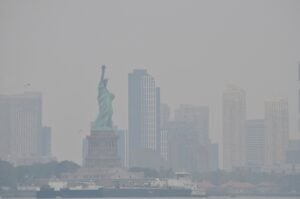
Then, in July 2026, wildfire smoke from Canada again blanketed the five boroughs. New York City Emergency Management reported that the regional AQI peaked at 289, in the Very Unhealthy category. The city described it as the second-most severe smoke event in its modern record, behind June 2023.
These modern episodes are different from the Thanksgiving smog of 1966. New York has greatly reduced many of the local sources that once created lethal blankets of sulfur-rich smoke, but wildfire pollution can travel hundreds or thousands of miles before reaching the city. A cleaner New York cannot completely insulate itself from atmospheric events occurring far beyond the five boroughs.
New York City’s Air Quality Today
The difference between 1966 and today is not that New York has solved air pollution. The difference is that the city can now see it coming, measure it across neighborhoods, warn the public quickly, and respond with information that residents can use.
Modern air monitors, satellite imagery, weather forecasting, public AQI alerts, indoor filtration, and emergency planning give New Yorkers tools that did not exist during the Thanksgiving disaster. When smoke returned in 2026, city agencies distributed masks, operated cooling centers, issued health warnings, and coordinated with state and federal agencies while the plume moved through the region.
That is the larger history of New York’s air. The city went from a time when soot, incinerator ash, high-sulfur fuel, and uncontrolled exhaust were accepted parts of urban life to an era in which a bad air-quality day becomes an emergency alert on millions of phones. The sky over New York is cleaner than it was in the middle of the 20th century, but the orange haze of 2023 and the wildfire smoke of 2026 are reminders that clean air is not something any city gets to take for granted.
More New York History
For more on the New York landmarks and transportation systems that appear throughout this story, explore our History of the Empire State Building, our History of New York’s Yellow Taxi Cab, and our first-hand look at Life on the Long Island Expressway.
Major New York City Air-Pollution Episodes at a Glance
| Year | Event | What Happened | Documented Impact |
|---|---|---|---|
| 1953 | November smog | Stagnant weather trapped smoke and combustion pollution over the city for several days. | About 220 excess deaths in Greenburg’s later estimate. |
| 1963 | January-February smog | A prolonged pollution episode coincided with stagnant winter weather. | Studies estimated hundreds of excess deaths, commonly about 300 to 405. |
| 1966 | Thanksgiving smog | A temperature inversion trapped carbon monoxide, sulfur dioxide, smoke, and haze from November 23 to 26. | 168 excess deaths estimated in a 1967 medical study. |
| 2023 | Canadian wildfire smoke | Long-range wildfire smoke turned the sky orange and pushed the AQI into the Hazardous category. | AQI readings rose above 400 during the worst of the event. |
| 2026 | Canadian wildfire smoke | Another major smoke plume affected the city during a summer heat emergency. | AQI peaked at 289, the second-most severe smoke event in the city’s modern record. |
Published August 8, 2026.
History of NYC Air Quality and Smog: From the 1966 Thanksgiving Disaster to Today article published on ClassicNewYorkHistory.com © 2026